
Relative Citation Ratio (RCR) - How it works and and when to use it.
Published:
The Relative Citation Ratio (RCR) was developed by the National Institute of Health (NIH), to improve the comparability of citation metrics for articles published in different years or across different academic fields. RCR provides a measure of an articles citation rate normalised to compensate for different citation behaviours across academic fields and for time since publication.
Prior to the introduction of the RCR, most field normalised citation metrics used pre-defined ontologies to define research fields. As an example, the Field Citation Ratio (FCR) uses the ANZSRC Field of Research (FoR) ontology in its field normalisation methodology. However, RCR relies on a novel field normalisation approach using an articles co-citation network to dynamically define the field for each article at a more granular local level.
The RCR metric has been found in studies to correlate better with human expert review than raw citation count and metrics using a priori defined field ontologies. Including in our own evaluation benchmarking article metrics with their UK Research Excellence Framework (REF) scores.
In this article we will explore how the RCR is calculated, how to interpret it as a proxy of a publications impact, and some of it’s caveats you should be aware of.
How is RCR Calculated
The RCR is built using the ratio of two components: The Article Citation Rate (ACR) which is the citation rate of an article of interest normalised by time since publication, and the Expected Citation Rate (ECR) which is the citation rate for articles in a similar field to the article of interest.
\[RCR = \frac{ACR}{ECR}\]Article Citation Rate (ACR)
The Article Citation Rate (ACR) is calculated as the total citations of the publication of interest (PI), time normalised by dividing by the difference between the most recent year and the PI’s year of publication.
\[ACR = \frac{PI\ Citation\ Count}{Most\ Recent\ Year\ - \ Year\ of\ Publication}\]This time normalisation of RCR decreases as an article’s citations decline over time, reducing the overall RCR score. Therefore, an articles RCR score should be interpreted as a reflection of its current academic influence and not it’s past influence at time of publication.
Expected Citation Rate (ECR)
The Expected Citation Rate (ECR) is calculated using a normalised Field Citation Rate (FCR), which is the expected citations from publications in the same research field as the PI as defined by it’s co-citation network.
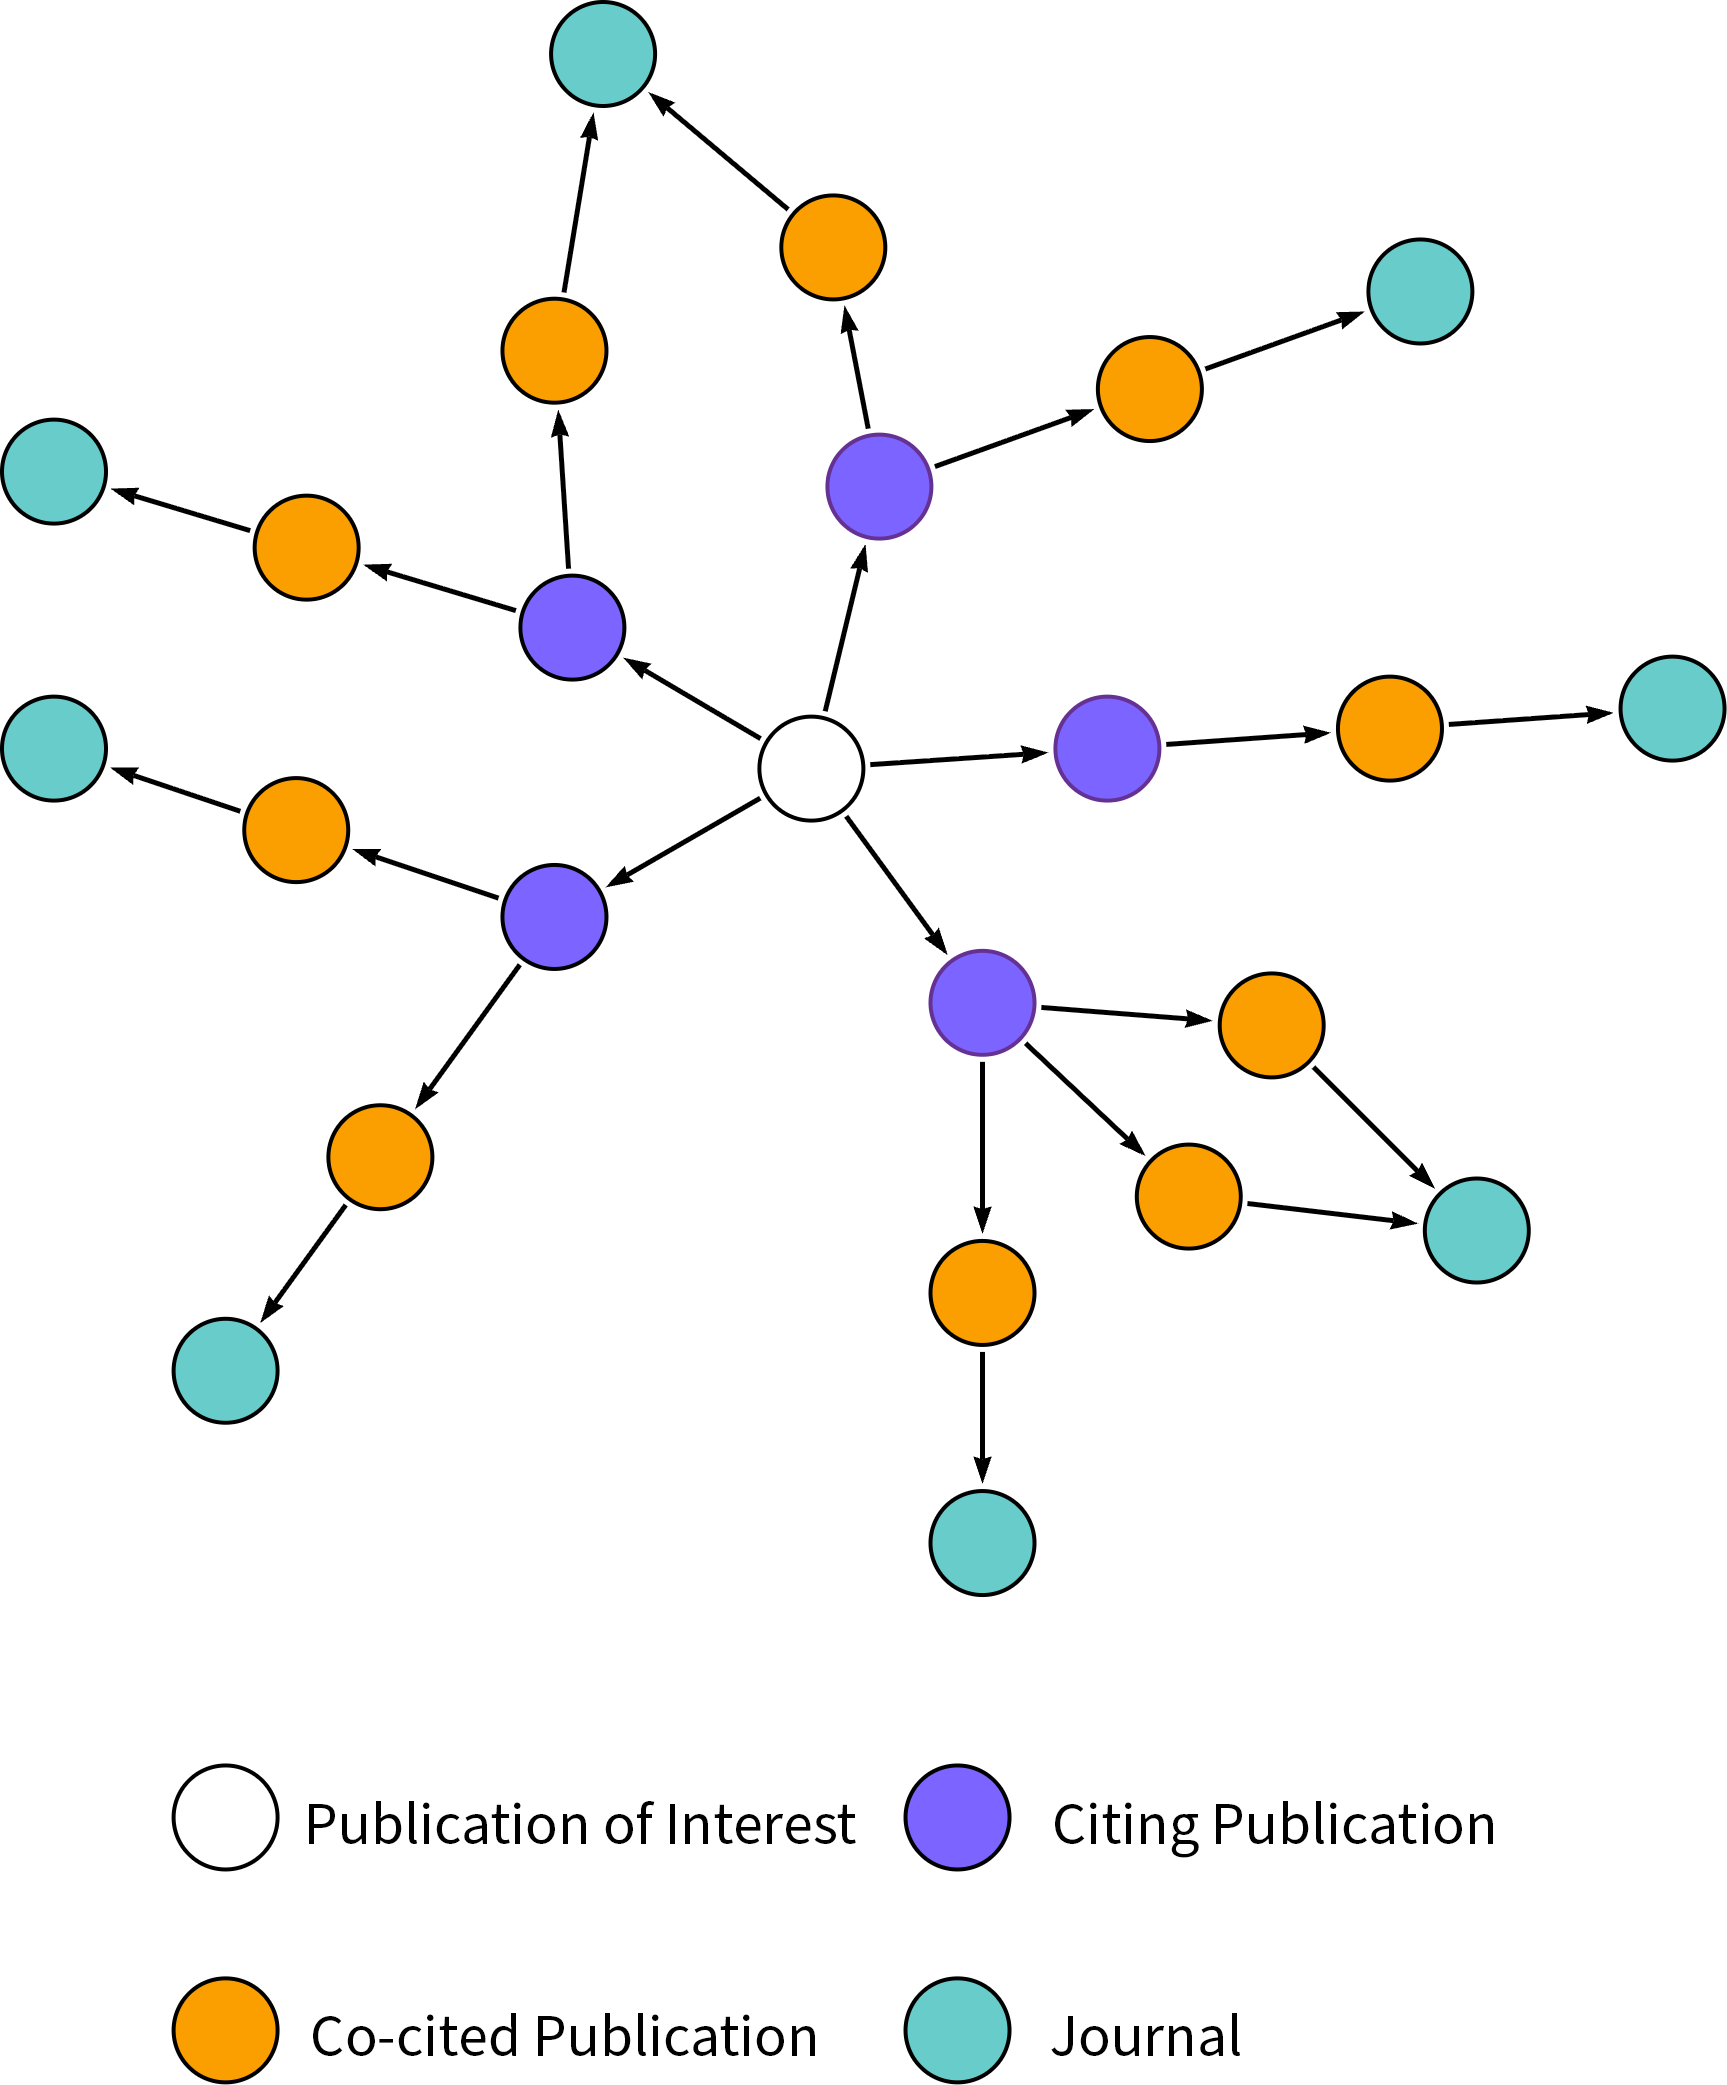
A co-citation network consists of all articles cited in articles that also cite the PI. In this case the co-citation network is a proxy for articles in the same field as the research article. The Journal Impact Factor (JIF) is used rather than the citation count of individual articles as this increases the sample size and makes the RCR more stable, with some caveats.
We will get into how the FCR and ECR are calculated but for now it’s probably useful to visualise how the co-citation network is constructed. The below diagram shows the co-citation network for a PI and the journals used to calculate the mean JIF.
More concretely the FCR is defined as: \(Fcr = \frac{\sum{JIF_i}}{N}\)
Identify all publications that are cited alongside the PI in citing publications, this gives you the PI’s co-citation network.
Sum the Journal Impact Factors (JIFs) of the journal each publication in the co-citation network is published in. If more than one publication is published in the same journal, the journal can be counted multiple times.
Finally divide the sum of JIFs by the number of publications in the citation network (N), to get the average JIF.
The FCR is then normalised to give the ECR used as the denominator in the RCR equation (so many acronyms!). This is done by multiplying the FCR with coefficients from a least squares linear regression model. This model has been trained to predict ACR scores based on the FCR of research publications in the NIH R01 Research Program Grant Program database.
\[ECR^{year} = \hat{B} \times FCR + \hat{a}\]Interpreting RCR
The RCR has a global score of 1.0 for average performing articles, with a score higher than one indicating better than average performance when compared to similar articles. The upper limit of the score is boundless, with a minimum score of 0.0.
Like most citation metrics, the distribution for RCR scores is highly skewed following a power law distribution with a long positive tail. This means that the mean of multiple RCR scores can be highly influenced by outlier effects and it may be better to use the median score for some analysis.
The articles in the long positive tail of this distribution can also be analysed to identify articles with exceptional RCR performance. However, care should be taken that the high performance of these articles is not due to score inflation caused any edge case limitations of the metric.
As older papers have more time to accrue citations, the RCR is time normalised by the number of years since publication. However, as citations of a particular work plateau over time, it’s RCR will begin to decrease rapidly with each passing year, even if that paper originally had a high citation rate.
This slow decay of RCR score should be taken into account in any analysis of RCR scores for older publications. With RCR being interpreted as a measure of current, sustained importance rather than the initial impact at time of publication.
Co-citation Approach Limitations
The RCR approach to field normalisation assumes that articles cited alongside an article of interest are within the same field. This can be confounded when citations or journals are inter-disciplinary, leading to erroneous and misleading RCR scores.
The RCR can also be deflated if an article is frequently cited by articles from fields that typically have a much higher citation rate than the field in which the original article was published. Undesirably penalising an additional citation and an increase in interdisciplinary impact. Inversely the RCR can also be inflated, sometimes strongly, if citing articles are frequently from fields with lower citation rates.
Guidelines for Bibliometric Analysis with RCR
General guidelines for use:
All citation based bibliometrics have a lag period that allows citations to accrue, I therefore would not recommend using RCR for measuring the performance of portfolio outputs younger than 2 years old.
RCR should not be used in isolation to assess organisation or portfolio performance, but as a tool in a wider toolbox.
RCR behaviour can be unstable if certain edge cases are present, these effects are smoothed out if aggregated robustly over a large number of data points.
As citation based bibliometrics follow a power-law or log-normal distribution, RCR can be sensitive to outlier effects, consequently median instead of arithmetic mean may need to be used when aggregating at a portfolio level.
Citation driven bibliometrics such as RCR are subject to the effects of several confounding variables, such as journal ranking, document type and gender. This should be considered during interpretation and normalised if necessary.
Care should be taken when comparing RCR across research organisations or funders, it may be necessary to normalise on several factors including amount funded, proportion of impact and size of research institutions.
Any caveats and context should be communicated alongside any bibliometric evaluation.